This tutorial is a companion to the following paper:
Thomas RJ, Chen S, Eden UT, Prerau MJ. Quantifying statistical uncertainty in metrics of sleep disordered breathing. Sleep Med. 2020 Jan;65:161-169. doi: 10.1016/j.sleep.2019.06.003. Epub 2019 Jun 13. PubMed PMID: 31540785; PubMed Central PMCID: PMC6938549.
AHI Uncertainty Calculator
Find our tools for calculating AHI uncertainty here.The Problem with AHI: Statistical Uncertainty
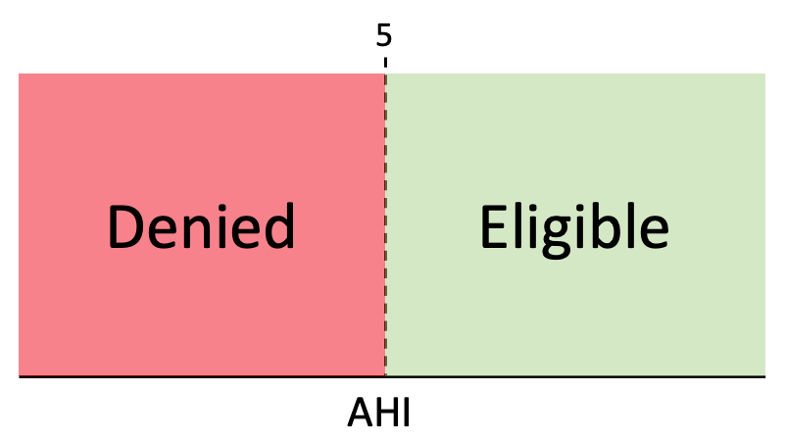
Sleep apnea is typically diagnosed with a sleep study, in which a patient’s sleep and breathing are monitored in a lab or at home. From this study, the average number of apnea-related breathing events per hour across the night is calculated, which is called the apnea-hypopnea index or AHI, for short. The value of the AHI is then compared to value determined by Medicare or an insurer, which serves as a clinical threshold. If the AHI is above that number, the patient is diagnosed as having sleep apnea and is eligible for treatment, such as a continuous positive airway pressure (CPAP) device, which is reimbursable under insurance or Medicare. If the AHI falls below that number, even by the smallest amount, the patient is denied reimbursable treatment.

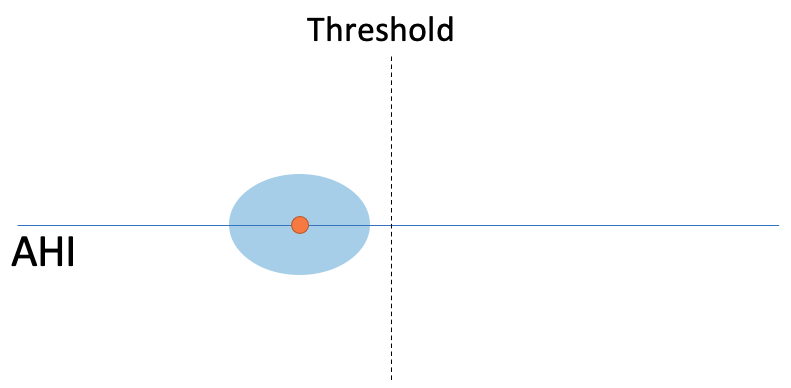
Currently, the AHI is treated as a single number that perfectly describes the patient’s condition. However, differences in sleep quality across nights, changes in sleep and breathing patterns within a single night, and variability from the limited amount of data collected in a single sleep study can potentially cause a great deal of variability associated this measurement. Given that a slight alteration in AHI value can be the difference between eligibility and denial of treatment, it is important to know how certain clinicians can be that an AHI will be on the same side of the threshold on a subsequent sleep study. To do this we need to understand the statistical uncertainty or variability around a given AHI value.In particular, it is important to know if the uncertainty around the AHI is small, such that it is not likely the difference could be by chance:

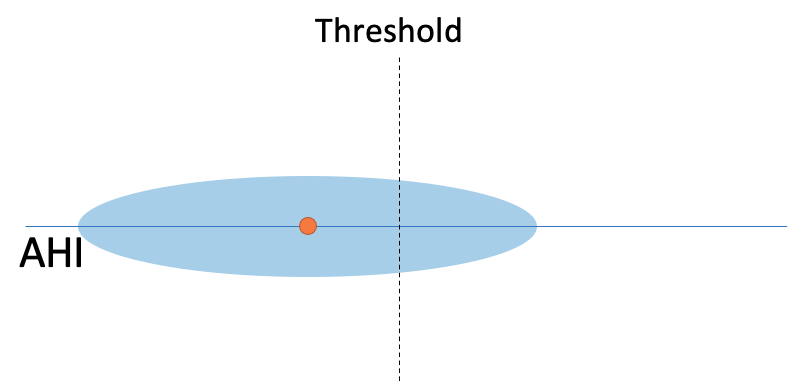
or large, such that the variability overlaps the threshold, suggesting that the value could be different due to chance:

A common way to quantify uncertainty is to compute a confidence interval around a statistic. A confidence interval at a given X% identifies the interval at which X% of values will fall upon multiple retests. So, for example, if an AHI has a 95% confidence interval from 3 to 7, we would expect that if we tested that subject multiple times, 95% of the values would fall within that range.
Measuring Uncertainty in AHI
Currently, AHI has no confidence interval. Therefore, we developed a method of estimating the statistical uncertainty associated with AHI so that we could compute appropriate confidence intervals for any given AHI, given the list of respiratory events and their times. In general, this method takes a subject’s respiratory data and simulates thousands of nights based on the statistical properties of the observed nights using a bootstrap procedure. For each of those simulated nights, the AHI is computed, which provides a probability distribution on the AHI value of that subject. From that distribution, confidence intervals can be computed. It should also be noted that these analyses can be extended to other related clinical indices such as CAI, RDI, etc.
Experimental Data
We applied this method to 2049 subjects (954/1095 M/F, age: mean 69 ± 9.1) from the Multi-Ethnic Study of Atherosclerosis (MESA), a diverse, population-based study of subjects between the ages of 45 and 84. For each subject, we computed the uncertainty around each subject’s AHI measurement, and determined how this might effect eligibility.
The Effect of AHI Uncertainty on Individual Patients
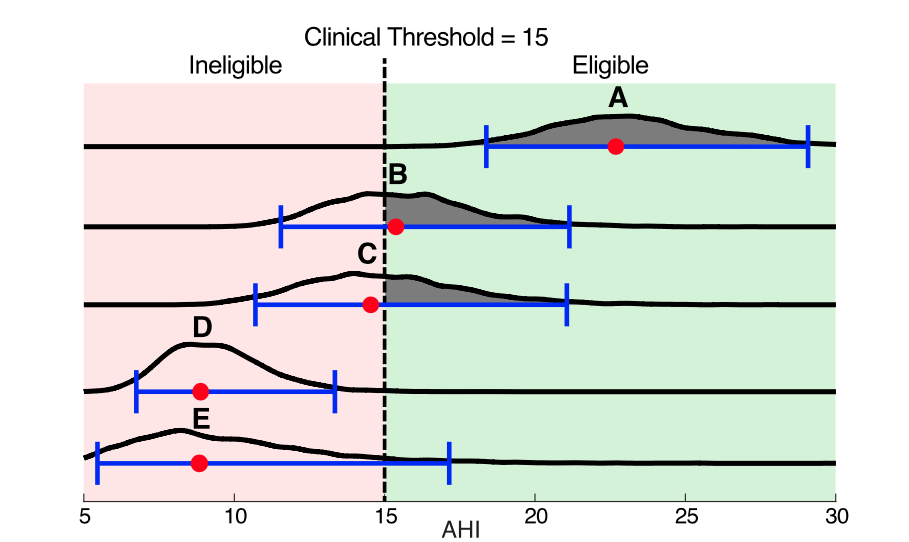
As an example, here are 5 real subjects from the MESA dataset, with the estimated AHI (red dot), 95% confidence interval (blue bars), and full probability distribution (black curves). The table below shows the number of events (N), total sleep time in hours (TST), the estimated AHI and 95% confidence interval (brackets), how wide the confidence interval is (CI Width), and the probability that the AHI would be above the threshold on a subsequent retest. Since they had no excessive daytime sleepiness, they are compared to a clinical threshold of AHI = 15.

Given current standards, subjects A and B would be considered eligible for treatment, and all others would be denied. However, when we look at the statistical uncertainty, we see much more:Subject A has an AHI well above the threshold and also uncertainty bounds, that, while large, do not encompass the threshold. It is thus highly likely that the subject will remain above threshold upon retest and that the diagnosis is not due to chance. Likewise, subject D is below threshold, with confidence intervals that do not overlap the threshold, suggesting it is unlikely that they would test above threshold upon retest.Subject B has an AH of 15.4 and would be eligible for treatment, whereas Subject C would be ineligible with an AHI or 14.5. However, for both of these subjects, the 95% confidence interval widths are roughly 20 times the distance from the observed AHI to the threshold, and the probabilities of being eligible are close to 0.5.
The AHI distributions show us that it is not only unclear if their “true” AHIs from the threshold, but also if they differ from each other. Given these factors, there is clearly not sufficient evidence in the data to deny treatment to one subject while granting it to the other. Thus, both of these subjects could have incorrect diagnoses due to chance, with Subject C being denied treatment.Subject E, like Subject C has an AHI of 7.3, however with only 3.7 hours of sleep. Consequently, Subject E’s AHI 95% confidence interval reaches all the way above the threshold to 17.1. So, we could not confidently deny Subject E eligibility. There is simply not enough information. This example shows how AHI uncertainty is especially exacerbated for patients with short sleep durations (e.g. split night studies).
Population AHI Uncertainty Reveals that Many Patients are Being Rejected Due to Chance
When we examined all 2049 subjects, the results were striking. The degree of uncertainty surrounding a given AHI value was very large with respect to the clinical thresholds, such that 43% of the subjects had diagnoses that could potentially be incorrect due to chance. Even when restricting analysis to only those subjects that reported excessive daytime sleepiness, 27% of these subjects had uncertain diagnoses. In both groups (all subject and those with excessive daytime sleepiness), the majority of the uncertainty would have been subjects denied eligibility. This translates to 1 out of every 5 to 6 patients (~17%) presenting at a clinic being denied due to chance.These results highlight a major shortcoming of the current eligibility standards. For many patients, the current diagnostic paradigm is similar to telling a runner that they have lost a race by a second if you are using a stopwatch that is only accurate to the minute. By measuring AHI uncertainty, it is now possible to place a diagnosis within the proper context based on the data provided and to move towards the creation of more statistically and clinically principled eligibility standards.
What Can Be Done?
Enhanced Clinical Reports
How then, can we address this problem? First and foremost, we should compute confidence intervals on the AHI clinically for all patients. Here is an example clinical report for an asymptomatic (ESS<10) subject from the MESA dataset:

In addition to the standard AHI values, we provide 95% confidence intervals around the AHI and probability of the AHI being above the threshold on retest. Similarly, we can compute the confidence interval for stage-dependent AHI empirical confidence intervals and above-threshold probabilities. In this particular case, the subject’s AHI values do not qualify them for treatment, however the upper confidence intervals are far above-threshold and retest probabilities are high. This suggests that there is not enough data to conclusively deny eligibility.
Better Diagnostic Criteria
One possibility is that, for cases in which a diagnosis is uncertain, clinicians should be able err on the side of inclusion or be able to use other information available to them to determine eligibility. Typically, in symptomatic patients, it is trivial to stop treatment if further data suggest a patient was erroneously diagnosed with sleep apnea. It is impossible, however, to start treatment for someone falsely undiagnosed if they are deemed ineligible. For these ineligible patients, any short-term treatment costs will be greatly offset by the long-term savings and health benefits.
Conclusion
This study shows that capturing uncertainty in AHI and related metrics is key to understanding patient diagnosis and as well as the effects of treatment. The statistical uncertainty in AHI is vast compared to the clinical thresholds, so it is therefore insufficient to rely on the relationship between a single number and threshold alone. Thus, new strategies must be developed to incorporate uncertainty, as well other available data, into clinical decision-making.