These tools are a companion to:
Thomas RJ, Chen S, Eden UT, Prerau MJ. Quantifying statistical uncertainty in metrics of sleep disordered breathing. Sleep Med. 2020 Jan;65:161-169. doi: 10.1016/j.sleep.2019.06.003. Epub 2019 Jun 13. PubMed PMID: 31540785; PubMed Central PMCID: PMC6938549.
Sleep apnea is typically diagnosed with a sleep study, in which a patient’s sleep and breathing are monitored in a lab or at home. From this study, the average number of nightly apnea-related breathing events per hour–the apnea-hypopnea index (AHI)–is calculated. The value of the AHI is then compared to a threshold value determined by Medicare or an insurer, which serves as a clinical threshold. If the AHI is above that number, the patient is diagnosed as having sleep apnea and is eligible for treatment, such as using a continuous positive airway pressure (CPAP) device, which is reimbursable under insurance or Medicare. If the AHI falls below that number, even by the smallest amount, the patient is denied reimbursable treatment.
Currently, the AHI is treated as a single number that definitively describes the patient’s condition. However, differences in sleep quality across nights, changes in sleep and breathing patterns within a single night, and variability from the limited amount of data collected in a single sleep study can potentially cause a great deal of variability associated with this measurement. Slight alteration in AHI value could mean that an AHI will be on one side of the threshold in one sleep study and the other side of the threshold on a subsequent sleep study, which can be the difference between eligibility and denial of treatment. It is therefore important to understand the uncertainty of the AHI statistic to determine the degree to which it is possible to be confidence in a given diagnosis.
To address these problems, we have developed two methods of estimating a confidence interval on the AHI based on what type of data are available.
Select the appropriate tool based on your data.
- Click here to estimate AHI uncertainty based on the number of events (N) and total sleep time (TST)
- Click here to estimate AHI uncertainty based on a list of respiratory event times
Estimate AHI Uncertainty from Event Count and Total Sleep Time

Instructions:
- Enter the total number of events over the course of the night
- Enter the patient’s total sleep time
- Select method
- Empirical (suggested): This method does the best guess of uncertainty based off of population data
- Poisson: This method is based off of theoretical properties and will be a conservatively low estimate of uncertainty
Interpretation:
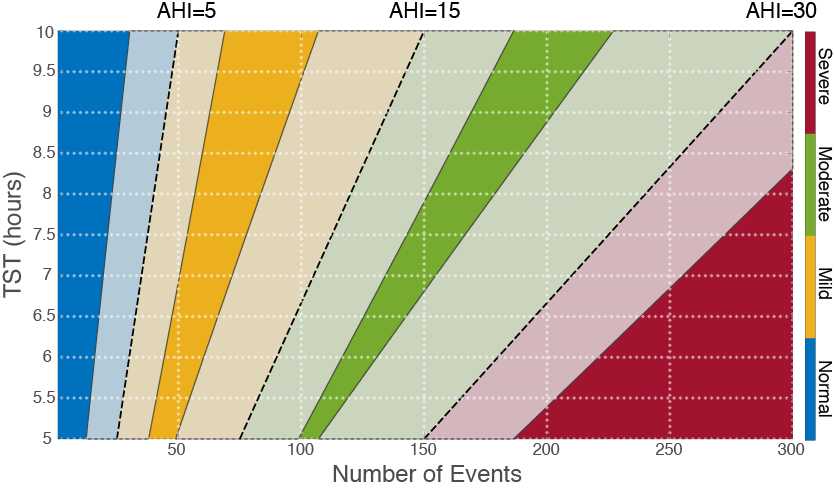
This tool will compute the AHI and the lower and upper bounds of the 95% confidence interval. The graphic illustrates the clinical thresholds for Mild (AHI>5), Moderate (AHI>15), and Severe (AHI>30) apnea (dashed lines) as a function of number of events (N) and total sleep time (TST). Values of (N, TST) at which the 95% confidence bounds encompass a clinical threshold are shaded in gray. These areas indicate N and TST values for which the count data alone does not provide enough information to determine the severity of a patient’s apnea.
Estimate AHI Uncertainty from Respiratory Event Timing
| Event Times | |
|---|---|
| Confidence Interval Size | |
| Clinical Threshold: |
Instructions:
- Enter the list of wake-adjusted respiratory event times in seconds into the text box (SEE NOTE BELOW)
- Select the confidence interval size
- Select the clinical threshold for comparison
- Press the COMPUTE EMPIRICAL CONFIDENCE INTERVAL button
NOTE: Wake does not count toward the total sleep time, therefore Wake time must be subtracted from the event time list. For example if there are events at the following times (in seconds): [100 300 450 575]. If Wake was scored from 200s to 300s, the 100 seconds of Wake time must be subtracted out. The wake-adjusted time would therefore be [100 200 350 475].
Interpretation:
This tool estimates the distribution on the AHI by simulating thousands of nights of sleep based on the respiratory event time list. From this distribution we can compute the 95% confidence interval (red dashed lines), the median AHI (blue line), and the probability of having an above-threshold AHI upon retest.